


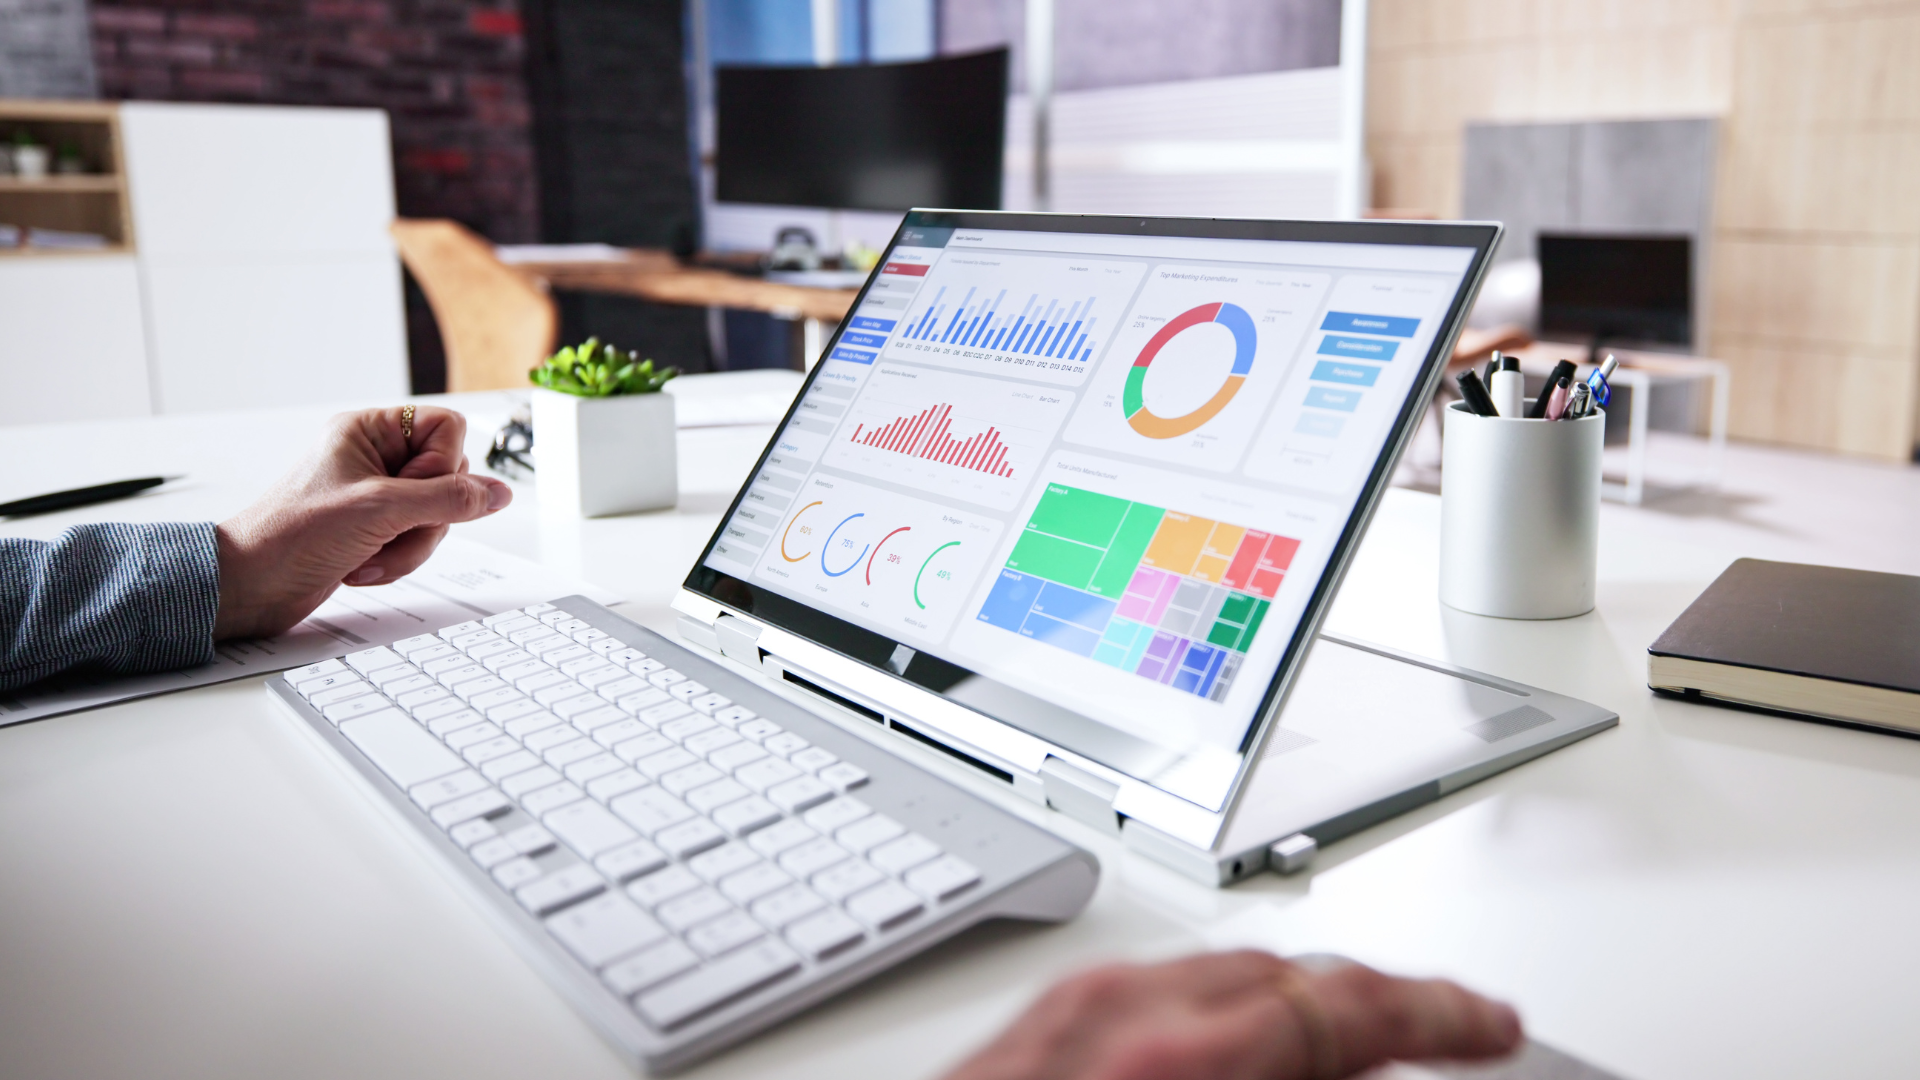
A KPI dashboard (Key Performance Indicator Dashboard) is a central business management tool that enables organizations to monitor and analyze key performance metrics in real time. It provides a clear, visual overview of the most important business indicators, helping decision-makers make data-driven decisions and support long-term business success.
Benefits of KPI Dashboards
KPI dashboards offer several key advantages. They ensure that all relevant data is updated in real time, keeping information accurate, current, and reliable. By providing a centralized platform, all important metrics are consolidated in one place and remain easily accessible at any time. Interactive features such as drill-down capabilities and filtering options enable detailed analysis and flexible data visualization. A unified data foundation enhances cross-departmental communication and decision-making, contributing to more effective collaboration. In addition, KPI dashboards improve transparency and control by clearly visualizing goals, performance metrics, and business outcomes.
Structure and Best Practices
When building a KPI dashboard, it is essential to clearly define the target audience and consider their specific information needs. The selection of relevant KPIs should focus on a small number of meaningful metrics to avoid information overload. Effective data visualization is equally important—using appropriate chart types such as line charts, bar charts, or pie charts helps present trends, comparisons, and deviations clearly. Standardization is another key factor. Developing consistent templates and design guidelines ensures a uniform and professional presentation. Finally, dashboard data should be updated regularly to maintain data quality, accuracy, and relevance.
Technological Foundations and Tools
Choosing the right technology and tools is critical to the success of a KPI dashboard. A wide range of software solutions is available to suit different business requirements and budgets. Some of the most widely used platforms include Qlik Sense, Tableau, and Power BI. These tools offer powerful data visualization and analytics capabilities while integrating data from multiple sources.
A comparison of open-source tools such as Grafana with commercial solutions shows that each has its own strengths and trade-offs. Open-source platforms are generally more cost-effective and flexible, whereas commercial solutions often provide more comprehensive support, maintenance, and enterprise services.
Another key consideration is integrating KPI dashboards with existing IT systems, such as ERP and CRM platforms. Seamless integration improves efficiency, enhances usability, and ensures that decision-makers have access to accurate, up-to-date information from across the organization.
Data Sources and Data Integration
The quality and availability of data are essential to the effectiveness of a KPI dashboard. It is important to develop a clear strategy for connecting and integrating data sources. This includes both internal sources, such as company databases, and external sources, such as market data. Leveraging big data can provide additional value by enabling deeper insights and more detailed analyses. High data quality and robust data security are crucial for ensuring that KPIs remain accurate, reliable, and meaningful. Therefore, data cleansing and validation methods should be an integral part of the overall data management strategy.
Design und Usability
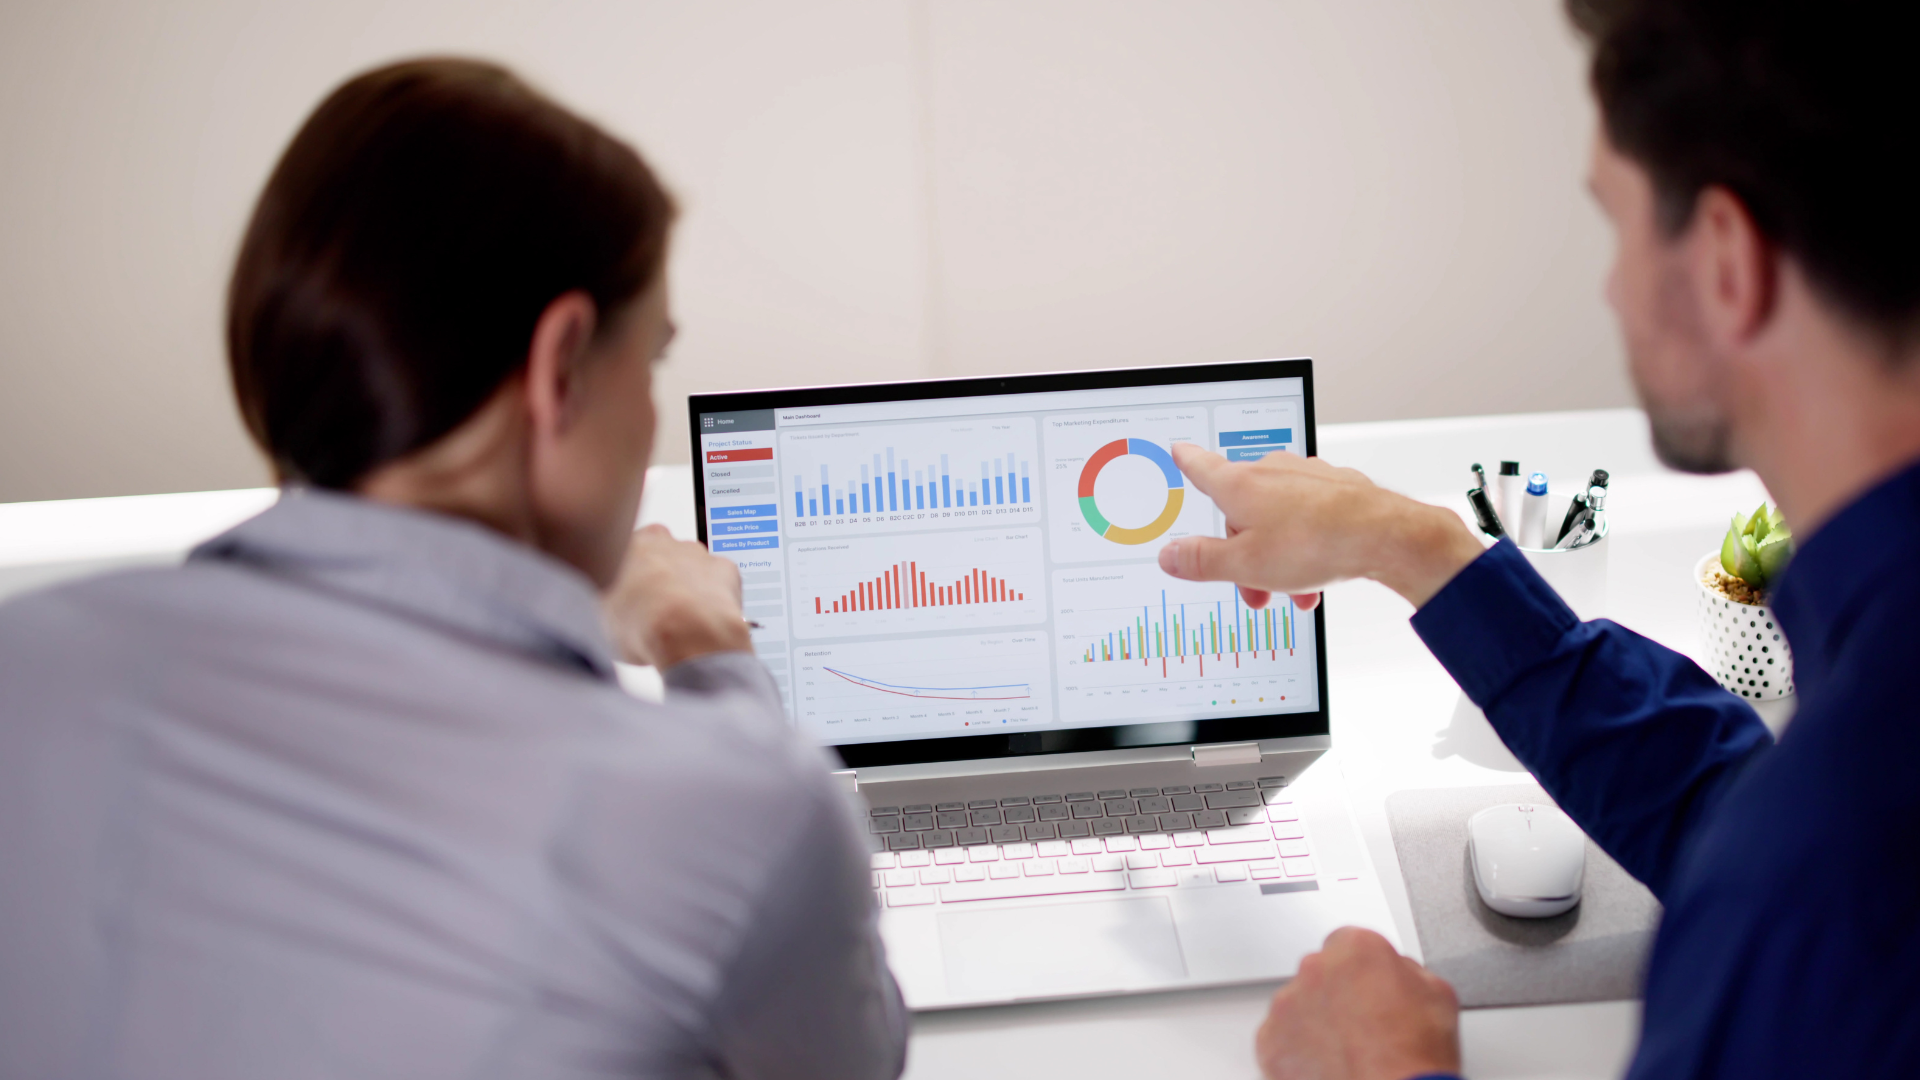
A well-designed KPI dashboard is not only functional but also intuitive to use. Best practices for dashboard design include selecting the appropriate chart types to effectively present different kinds of data. Colors and visualization techniques play a key role in improving data clarity and making insights easier to understand. A user-centered design ensures that the dashboard meets the needs of different user groups, from executives to operational teams. Usability can be further enhanced with interactive features such as drill-downs and filter options, allowing users to explore data in greater detail and perform targeted analyses.
Advanced Analytics and Features
Modern KPI dashboards go beyond simple data visualization by incorporating advanced analytics and intelligent features. Predictive analytics enables organizations to forecast future trends and take proactive action. The use of artificial intelligence (AI) and machine learning (ML) provides deeper insights and uncovers patterns that would be difficult to detect through manual analysis. What-if scenarios and simulations are also valuable capabilities, allowing businesses to evaluate different strategic decisions and assess their potential impact before implementation. These advanced analytical features support informed decision-making and contribute to the continuous optimization of business processes.
Mobile KPI-Dashboards
The development and use of KPI dashboards on mobile devices is becoming increasingly important. Mobile dashboard solutions offer the advantage of providing real-time data anytime and anywhere. This enables executives and employees to make informed decisions while on the go and maintain constant visibility into key performance metrics. The main challenge is optimizing the user interface for smaller screens while ensuring a high level of usability, responsiveness, and functionality.
KPI Dashboards for Startups
For startups, KPI dashboards are especially valuable because they help track key business metrics and support sustainable growth. By using KPI dashboards, early-stage companies can measure performance, identify weaknesses, and respond quickly to changing business conditions. It is important for startups to define the right KPIs from the outset and choose appropriate dashboard tools to effectively visualize and analyze their data. Learning from successful examples and following best practices can also help startups overcome the challenges of implementing KPI dashboards and maximize their value.
KPI Dashboards for Employee Performance Evaluation and Motivation
An often overlooked benefit of KPI dashboards is their use in evaluating employee performance and increasing motivation. KPIs can make individual and team performance transparent, providing a clear view of how each employee contributes to the organization’s overall success. By visualizing KPIs in a dashboard, employees can monitor their progress and achievements in real time, leading to higher motivation and stronger engagement.
Managers can use KPIs to deliver constructive feedback and set measurable goals based on each employee’s strengths and areas for improvement. In addition, KPI dashboards help foster a culture of transparency and accountability by establishing clear expectations and making performance metrics visible throughout the organization.
Regular reviews and updates of key performance indicators ensure that employees remain aligned with business objectives and continue contributing to the company’s success. This not only enhances individual performance but also boosts overall productivity and team efficiency. Furthermore, involving employees in the process of defining and monitoring KPIs strengthens their sense of ownership and engagement, ultimately creating a more positive, collaborative, and productive work environment.

Data Privacy and Security in KPI Dashboards
Data privacy requirements and security measures are critical when using KPI dashboards. Organizations must ensure that their data is protected in accordance with applicable data protection regulations, such as the General Data Protection Regulation (GDPR). This includes implementing data backup procedures, access controls, and encryption for sensitive information. Another important consideration is compliance with regulatory requirements to minimize legal and operational risks. By adopting robust security protocols, organizations can safeguard the integrity and confidentiality of their data while strengthening the trust of customers, partners, and other stakeholders.
Interactive KPI Dashboards
The development of interactive KPI dashboards enables deeper insights and more comprehensive data analysis. Interactive dashboards offer features such as filters, drill-downs, and customizable views, allowing users to explore specific data in detail and quickly access the information most relevant to their needs. These capabilities are especially valuable for executives and analysts who need to interpret complex data and make well-informed decisions. By enhancing both usability and analytical capabilities, interactivity not only improves the user experience but also increases the effectiveness of KPI dashboards as a strategic business management tool.
Examples and Applications
A management KPI dashboard is designed to monitor overall business performance and identify opportunities and risks at an early stage. Typical KPIs include revenue, customer count, customer acquisition cost (CAC), and customer lifetime value (CLV). The dashboard often includes features such as drill-down capabilities and year-over-year comparisons to support in-depth performance analysis.
A financial KPI dashboard helps ensure liquidity and maintain the organization’s financial health. It tracks key performance indicators such as cash flow, invoice status, and the cash-to-cash cycle. Automated financial reporting enables organizations to detect deviations early and respond proactively.
In sales, a KPI dashboard is used to optimize sales processes and improve overall sales performance. Common KPIs include lead response time, contact rate, and sales cycle length. The dashboard provides a comprehensive overview of sales activities and helps identify best practices for improving results.
A marketing KPI dashboard evaluates marketing performance and supports the optimization of marketing budgets. Key metrics include cost per acquisition (CPA), customer lifetime value (CLV), and return on investment (ROI). The dashboard enables detailed analysis of marketing costs and campaign performance, helping organizations maximize the effectiveness of their marketing efforts.
Implementation and Usage
For the successful implementation of a KPI dashboard, the first step is to assess existing reports and evaluate their usefulness. Next, the most relevant key performance indicators should be selected and defined based on the organization’s strategic objectives. Integrating multiple data sources ensures the availability, accuracy, and consistency of the data. The dashboard should then be designed and developed with the needs of its intended users in mind. Finally, employees should receive proper training to help them effectively use the dashboard and integrate it into their daily workflows.
A KPI dashboard is an essential tool for effective business management and informed decision-making. It provides a centralized and transparent view of the organization’s most important performance metrics, enabling data-driven optimization of business processes. With careful planning and successful implementation, a KPI dashboard can make a significant contribution to long-term business success.

Frequently Asked Questions About KPI Dashboards
What Is a KPI Dashboard and Why Is It Important?
A KPI dashboard (Key Performance Indicator dashboard) is a visual tool that presents an organization’s most important performance metrics in real time. It is essential because it provides a centralized platform where executives and teams can monitor performance, make data-driven decisions, and drive business success. By visualizing key performance indicators, organizations can quickly identify changes, respond proactively to emerging trends, and adjust their strategies to achieve their objectives more effectively.
What Are the Benefits of Using KPI Dashboards?
KPI dashboards offer numerous benefits. They ensure that all relevant data is updated in real time, keeping information accurate, current, and reliable. By providing a centralized platform, all key performance metrics are consolidated in one place and are accessible whenever needed. Interactive features such as drill-downs and filter options enable in-depth analysis and flexible data visualization. A unified data foundation also enhances cross-department communication and supports more effective decision-making, leading to stronger collaboration. In addition, KPI dashboards improve transparency and control by clearly visualizing business objectives and key performance metrics, helping organizations track progress and make informed decisions.
How Do I Choose the Right KPIs for My Dashboard?
The right key performance indicators (KPIs) depend on your organization’s specific goals and business requirements. It is essential to select KPIs that are directly aligned with your business objectives, measurable, realistic, and capable of providing a clear view of organizational performance. The chosen KPIs should also be relevant to the needs of different business units and departments, while being easy for both executives and employees to understand and use. For example, commonly tracked KPIs include revenue, customer count, and customer acquisition cost (CAC), all of which provide valuable insights into business performance and growth.
Which Technologies and Tools Are Best for KPI Dashboards?
There are many tools and software solutions available for KPI dashboards, and the right choice depends on your organization’s requirements and budget. Some of the most widely used platforms include Qlik Sense, Tableau, and Microsoft Power BI, which offer powerful data visualization, advanced analytics, and seamless integration with data from multiple sources.
Geckoboard is another popular solution, particularly for displaying real-time data through intuitive, easy-to-read dashboards. Datapine is designed for small and medium-sized businesses, providing interactive dashboards that are user-friendly and simple to implement.
When evaluating KPI dashboard tools, organizations should consider factors such as integration capabilities, scalability, customization options, ease of use, and reporting features to ensure the solution aligns with their business objectives and supports data-driven decision-making.
How Do I Integrate Multiple Data Sources into My KPI Dashboard?
Integrating multiple data sources is essential for maximizing the effectiveness of a KPI dashboard. Start by identifying all relevant data sources, including ERP, CRM, accounting systems, marketing platforms, and social media channels. Use ETL (Extract, Transform, Load) tools to extract, transform, and load data into a centralized repository for analysis.
It is equally important to ensure that the data is clean, accurate, and consistent to support reliable reporting and meaningful insights. API integrations and automated data pipelines can be used to synchronize and update data in real time, ensuring that your dashboard always reflects the latest information. By combining multiple data sources into a single, unified view, organizations can gain more comprehensive insights and make better-informed, data-driven decisions.
How Can I Ensure That My KPI Dashboard Is User-Friendly?
A user-friendly KPI dashboard should feature an intuitive interface, clear and easy-to-understand visualizations, and interactive capabilities such as drill-downs and filter options. It should also be optimized for a variety of devices, including smartphones and tablets, allowing users to access critical business data wherever they are.
Regularly gathering user feedback and continuously refining the dashboard is equally important. By incorporating suggestions from executives, managers, and employees, organizations can ensure that the dashboard remains aligned with user needs, improves usability, and continues to support effective, data-driven decision-making.
How Can I Ensure Data Security and Privacy in My KPI Dashboard?
Data privacy and security are essential to the reliability and trustworthiness of a KPI dashboard. Organizations must ensure that their data is protected in compliance with applicable data protection regulations, such as the General Data Protection Regulation (GDPR). This includes implementing measures such as secure data backups, role-based access controls, and encryption of sensitive information to prevent unauthorized access and data breaches.
Regular security audits and vulnerability assessments are also important for identifying and addressing potential risks before they can be exploited. In addition, using secure and trusted software solutions and cloud services helps maintain the integrity, availability, and confidentiality of business data. By combining robust security practices with regulatory compliance, organizations can safeguard sensitive information, reduce legal and operational risks, and strengthen the trust of customers, partners, and stakeholders.