The most important facts in brief
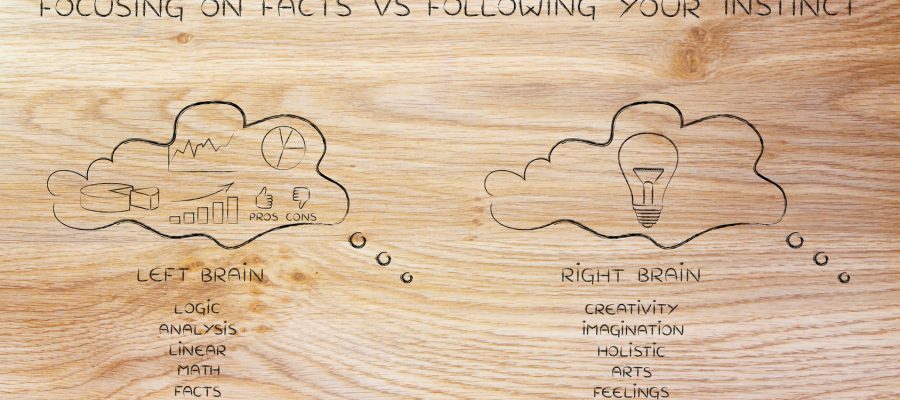
Augmented analytics is revolutionizing the world of data analysis through the targeted use of artificial intelligence (AI) and machine learning (ML). The aim is to make analytical processes smarter, more efficient and more accessible – for both data scientists and business users. The technology not only automates data preparation and analysis, but also actively supports the interpretation and communication of findings, for example through natural language processing (NLP).
Integration into business intelligence platforms such as Qlik or SAP Analytics Cloud enables a new level of self-service analytics. Companies benefit from faster decision-making, more in-depth insights and better use of resources – a decisive competitive advantage in the data-driven environment.
Vereinbaren Sie mit uns einen kostenfreien Beratungstermin.
Beratungstermin vereinbarenWhat is augmented analytics?
Augmented analytics describes the next evolutionary stage of data analysis. It focuses on the use of artificial intelligence (AI), machine learning (ML) and natural language processing (NLP) to make analytical processes in companies not only faster, but also more intelligent and accessible. This is not a new tool, but rather a functional extension of existing business intelligence platforms.
The aim is to automate the analysis process in order to enable non-analysts – i.e. specialist users without in-depth data expertise – to make well-founded, data-based decisions. Augmented analytics supports users in preparing, analyzing, interpreting and communicating data – often even using natural language.
From classic to intelligent data analysis
In the traditional BI world, users had to know exactly which question they wanted to answer, which data was required for this and how to create the appropriate visualizations. With augmented analytics, the system increasingly takes over these steps automatically:
- Patterns are recognized without having to search for them explicitly
- Anomalies are reported before they are noticed
- Forecasts and recommendations for action are actively proposed
- Questions can be asked and answered in natural language
- Machine learning (ML): Algorithms that recognize patterns and make predictions.
- Natural Language Processing (NLP): Processing and analysis of natural language input.
- Self-service BI: Users can create their own analyses without IT support.
- Predictive analytics: Forecasts of future events based on historical data.
- Data storytelling: Automated preparation of complex data as comprehensible narratives.
Differentiation from traditional business intelligence
The difference to classic BI lies not in the “what”, but in the “how”. While traditional systems rely on manual operation, augmented analytics performs many tasks automatically. The users set the target – the systems provide the appropriate answers, patterns, outliers and even interpretations.
This automation does not mean less control, but more efficiency, relevance and scalability in the analysis process. This not only changes the roles within the company, but also the expectations of data work as a whole.
The technological foundations of augmented analytics
Augmented analytics is based on the intelligent combination of modern technologies, which together enable a significantly higher degree of automation and interpretation than conventional business intelligence solutions. These systems are not just tools for visualizing data, but active partners in gaining knowledge. Three central areas of technology characterize this development:
Machine learning and artificial intelligence
Machine learning (ML) is the backbone of augmented analytics. ML models analyze huge amounts of data, identify patterns and generate predictions – without the user having to explicitly model them. This makes analysis processes more dynamic, more precise and much more efficient.
Typical fields of application for ML in augmented analytics:
- Classification of customer segments
- Forecasting sales trends
- Detection of anomalies (e.g. in financial data)
- Identification of correlations in extensive data sets
These functions run automatically in the background and support users in making data-based decisions in real time.
Natural Language Processing (NLP)
Natural language processing is the key to interaction between humans and machines. It enables language-based querying and interpretation of data – both in written and spoken form.
Examples:
- User asks: “How did sales develop in Q2 compared to Q1?”
- The system automatically delivers: suitable visualizations, key messages, recommendations
This function not only makes it easier for non-technical users to use, but also promotes the dissemination of data-based decisions throughout the company – without barriers.
Automated data preparation and pattern recognition
A major time waster in traditional analysis processes is data preparation: cleansing, validating, transforming and aggregating data from different sources. Augmented analytics provides massive relief here:
- Automated detection of data quality problems
- Suggestions for transformations based on data type and objective
- Linking and harmonizing heterogeneous data sources
These functions reduce the technical workload for data analysts and create scope for strategic issues.
How does augmented analytics work in the company?
The use of augmented analytics is changing the way data is processed, analyzed and used in companies – from operational queries to strategic decision-making. The central question is: How can data be turned into intelligent insights – without manual modeling and technical hurdles?
Augmented Analytics enables an end-to-end analysis workflow in which data scientists, analysts and business users work together productively. The system supports all phases of the analysis process: from data preparation to the interpretation of results.
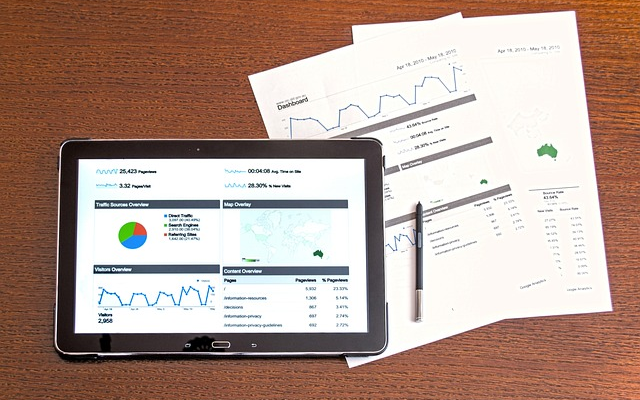
Overview of the analysis process
A typical analysis process in companies runs through several steps – from data collection to the derivation of specific recommendations for action. Augmented analytics tools are increasingly automating key tasks, reducing frictional losses and enabling seamless analysis across different areas of the company.
Classic BI process vs. augmented analytics
| Process phase | Classic BI | Augmented Analytics |
|---|---|---|
| Data access | manual, IT-controlled | Self-service access, automated |
| Data preparation | time-consuming, manual | automatic cleansing & transformation |
| Analysis | by analysts, on request | AI-supported, dynamic analysis |
| interpretation | often subjective | Data-based recommendations by NLG |
| Communication | static reports | interactive dashboards & text insights |
| Decision | delayed, multi-stage | fast, data-based, decentralized |
Example workflow – from raw data import to recommended action
The practical process in augmented analytics tools usually involves the following phases:
- Import of data records from ERP, CRM or external sources
- Automatic data preparation (cleansing, transformation, connection)
- Analysis using AI models (e.g. clusters, trends, correlations)
- Creation of automated visualizations
- Language-based explanations & recommendations
- Integration into existing workflows or BI platforms
Business benefits – Why is it worth using?
Augmented analytics is not a technological end in itself – on the contrary: the greatest added value lies in its concrete impact on business processes, decision-making quality and resource utilization. Companies that rely on augmented analytics achieve faster, more precise and strategically sound results – and on a broad data basis.
Augmented analytics also creates the conditions for all areas of the company – from sales and controlling to HR – to be able to work with data at eye level.
- For management: faster strategic decisions thanks to automated insights.
- For specialist departments: self-service access to precise data without IT dependency.
- For IT: Relief through automation and standardization of data preparation and reporting.
Key benefits at a glance:
1. faster decision-making processes
Automated analyses and language-based insights significantly shorten decision-making cycles – both at an operational and strategic level.
2. higher data quality and less effort
Automatic error detection, duplicate cleansing and smart data linking ensure a better basis – with reduced preparation time at the same time.
3. democratization of data analytics
Departments can ask questions, test hypotheses and interpret results independently – without technical overhead.
4. scalability and efficiency
Augmented analytics is able to efficiently process large volumes of data from a wide variety of sources – whether structured ERP data, CRM information or external market key figures.
5. stronger customer loyalty through individualized analysis
By combining customer data, behavioral patterns and forecasting models, companies can develop tailor-made offers and services that respond directly to user needs.
6. better use of resources
Employees spend less time on repetitive analysis tasks and can concentrate on value-adding activities.

Typical areas of application in practice
Augmented analytics reveals its strengths not only in theory, but above all in practice. The technology enables a wide range of departments to work in a data-driven way – independently of IT, but always on the basis of valid, AI-supported findings.
Here is an overview of the most important fields of application:
Controlling & Planning
Controlling is all about transparency, reliability and future orientation. Augmented analytics provides support here:
- Automated forecasts and scenario models
- Early identification of budget variances
- Automatic commenting of KPI dashboards
- Integration in planning solutions (e.g. Corporate Planner, SAP Analytics Cloud)
The result: faster planning cycles and more informed strategic decisions.
Sales & customer loyalty
In sales, augmented analytics provides decisive impetus for customer relationships and sales development:
- Analysis of purchasing behavior, returns and churn risks
- Derivation of personalized measures for customer loyalty
- Predictive lead scoring and offer optimization
- Visualized performance indicators for managing sales teams
This makes individual customer patterns visible and translates them into sales potential.
Production & quality management
Efficiency, process reliability and quality are key in production – augmented analytics provides support:
- Detection of production anomalies in real time
- Forecasting maintenance requirements (predictive maintenance)
- Analysis of machine, sensor and logistics data
- Optimization of material flows and reject rates
Big data from the store floor thus becomes a real management tool.
HR & employee analytics
Analytics is also becoming increasingly important in human resources – for example in:
- Analysis of fluctuation rates and satisfaction values
- Identification of further training needs
- Headcount planning based on projections
- Matching skillsets with project requirements
Augmented analytics makes HR decisions comprehensible, fact-based and strategically robust.
Integration into existing business intelligence platforms
Strategic expansion instead of system change
Augmented analytics is not a replacement for existing business intelligence platforms – it extends their functionality with intelligent, automated and user-friendly analysis components. Providers such as SAP, Qlik, Microsoft and Tableau have developed their solutions accordingly in recent years. The extension is carried out either natively within the existing platform, via dedicated modules or through cloud services that can be flexibly docked.
The advantage: companies benefit from existing data models, security standards and user training and do not have to carry out complete system migrations.
How usage and analysis processes are changing
The integration of augmented analytics is noticeably changing daily analysis processes. Instead of traditional reporting requirements or manual data modeling, the focus is on automated analyses, suggestions and voice-based interactions. This makes business intelligence more accessible to a broader user group, for example in sales, controlling or operational management.
The platforms are developing into genuine analytics assistants that actively think for themselves and guide the user through the analysis process – from data selection to interpretation of the results.
Prerequisites for successful integration
For a successful introduction, it is crucial that both technical requirements and organizational structures are prepared. It is particularly important that relevant data sources are connected, roles and authorizations are regulated and users are trained. Integration into existing workflows should also be seamless – for example in planning, sales or customer processes.
With the right planning, augmented analytics can deliver productive added value within a few weeks – without additional tool diversity or increased maintenance complexity.
Challenges and limitations of augmented analytics
As promising as augmented analytics is, the technology is not a panacea. In order to unleash its full potential, companies need to create the technical prerequisites and accompany organizational changes. At the same time, the limits of automated analysis need to be known and consciously managed.
Data quality remains crucial
Augmented analytics cannot work miracles if the underlying data is inadequate. Incomplete, outdated or incorrect data leads to distorted results, even with AI-supported tools. A stable, verified and well-documented database is still the most important success factor for any data-driven initiative – regardless of how advanced the analytics tool is.
Trust in AI and interpretability of results
Management in particular is often skeptical of “black box” models. When recommendations are generated automatically, the question arises: how comprehensible and explainable are these analyses? Companies should take care to use solutions that rely on transparent algorithms – or at least offer mechanisms to make decisions explainable.
Professional responsibility despite automation
Augmented analytics eases the burden – but does not replace technical expertise. The interpretation and classification of the results remains a human task. Anyone who makes automated decisions without critically scrutinizing them risks making mistakes. It is therefore important to develop and promote analytics skills within the company in a targeted manner.
Technological and organizational complexity
The introduction of augmented analytics is more than just a software project. It requires:
- the adaptation of workflows and responsibilities
- an effective role model for data access and use
- Resources in IT, data management and specialist departments
- Clear governance structures, especially for sensitive data
If this foundation is lacking, there is a risk of becoming bogged down in isolated solutions without any strategic effect.
- “The software does everything automatically”: without professional support, a lot of potential remains untapped.
- “Our data is already ready”: Data quality, consistency and structure are often lacking.
- “Everyone should get started straight away”: Without targeted training, you overwhelm users and create resistance.
- “We need a new platform for this”: Existing BI systems can usually be expanded efficiently.
Outlook – trends and the future of augmented analytics
Augmented analytics is still at the beginning of its development – the potential is far from exhausted. AI-supported analysis processes are already changing the way companies understand and interpret data and translate it into business decisions. This development will gain momentum in the coming years.
From reactive analysis to intelligent control
While today’s applications still focus heavily on automating existing analysis tasks, the systems are increasingly developing into active control elements in corporate management. In future, tools will not only explain what has happened, but also predict what will happen – and why. And more importantly, they will actively suggest what to do.
Three key future trends at a glance
1. conversational analytics as the new standard
Interaction with data is becoming increasingly natural: voice input, chat-based analysis assistants and AI-generated text interpretations enable analytical work in dialog format – even for non-analysts.
2. integration into operational processes
Augmented analytics is leaving the traditional BI environment and becoming an integral part of operational workflows – for example in CRM systems, ERP processes or planning tools. Data analyses run in the background – and proactively suggest measures.
3. explainable AI & transparency
The demand for comprehensible analysis models is growing. Providers are responding with new visualizations, explainable algorithms and transparency functions that make even complex model logic understandable for specialist users.
- 2025: 80% of all companies use AI-based analysis functions in their BI platform
- From 2026: Conversational interfaces are standard for data analytics solutions.
- In the long term, augmented intelligence does not replace people – it enhances them.
FAQ on augmented analytics
What is the definition of augmented analytics?
Augmented analytics refers to the expansion of traditional business intelligence (BI) solutions using technologies such as artificial intelligence (AI), machine learning (ML) and natural language processing (NLP). The aim is to automate data analyses, make them more user-friendly and accessible to non-technical users.
What analysis options does augmented analytics offer compared to traditional BI?
In contrast to traditional BI, where data queries are defined manually, augmented analytics offers a wide range of advanced analysis options: automatic pattern recognition, predictive models, anomaly detection and voice-based interactions. The systems suggest relevant analyses – often without explicit queries from the user.
What methods and features are typical of modern augmented analytics tools?
Typical methods include clustering, regression, classification and forecasting – usually based on integrated machine learning models. Important features include automatic dashboards, annotated results, natural language queries and automated recommendations for action. This combination sustainably improves the efficiency and quality of data analyses.
How does data preparation work with augmented analytics?
Automated data preparation is a key advantage: data is cleansed, validated and linked – often directly when the data sets are imported. Users do not have to define complex transformation rules, as the software suggests suitable steps or carries them out independently. This saves time and reduces sources of error.
In which areas of company management does augmented analytics bring concrete improvements?
Augmented analytics shows particularly great potential in areas such as finance, sales, controlling and HR management. Here, it provides support for budget analyses, sales forecasts and employee development. The automated provision of relevant information leads to faster decisions and a significant improvement in the quality of administrative decision-making.